Abstract
In this paper we present a commodity chemicals model that focuses on the dynamics of capital investment and pricing. The model explores the role these dynamics play and points to the availability of finance as a major driver of cyclical behaviour in investment and pricing.
What follows discusses (a) project objectives, (b) the development and structure of the model, (c) model communication issues and their resolution, (d) emerging insights and (e) future research objectives and aspirations.
Introduction
The source of cyclicality in capital
intensive industries has been a major focus of system dynamics
modelling. For example Sterman (1989) describes
a generic stock-adjustment model that is a key structural element
of cyclical systems while Bunn & Larsen (1992) analyse investment
cyclicality in the privatised UK electricity industry.
The emerging hypothesis behind this work is that cyclicality is driven mainly by the dynamics of financial capital available to fund investment. To demonstrate this proposition we assume (as in microeconomics) that industry players are rational economic agents who share the same expectations about the future and who signal their investment intentions (Porter 1980, chapter 15, provides a useful synopsis of microeconomists' thinking about capacity expansion in capital intensive industries). However, we depart from classical microeconomics by allowing industry stakeholders (including financial institutions) to adopt locally optimising policies which over time may produce a sub-optimal outcome for the industry as a whole
In trying to understand what drives
cyclical behaviour we contrast two levels of analysis. We first
examine dynamic behaviour of the industry as a whole. Then we
examine behaviour of individual firms assuming different objective
functions and competitive strategies for different players. In
this paper we focus attention primarily on the industry model.
The project has three objectives:
Background
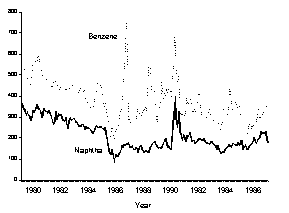
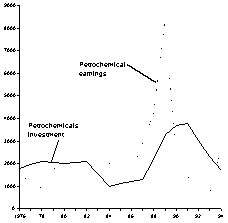
Cyclicality is a persistent phenomenon in commodity chemical industries. Typical price profiles are noisy with cyclical effects rippling through the multiple feed-stocks that are used to produce a commodity chemical product (see figure 1). In addition to the noise one can typically see price "fly-ups" appearing at regular intervals. The magnitude of these "fly-ups" cannot be fully explained by volatility either in end-demand or the supply of feedstock. The prevailing industry hypothesis is that this cyclicality is supply driven and its main causes lie in the "physics" of the industry (such as long construction lead times, high percentages of capacity added in each investment cycle, high capital intensity, etc.). Our additional working hypothesis is that industry investment, funding and pricing are equally responsible for the observed cyclicality. This relationship is particularly evident in the period from the early 80's and again in 89-92 when the industry built capacity aggressively during downturns. On the other hand, investments were cut back in 1986 and again in 1993 making the industry unprepared for the corresponding business upturns (see figure 2).
| Price: in $/ton | Investment vs Earnings: $ Millions |

| Figure 1: Benzene/Naphtha Chain | Figure 2: Investments for a Subset of World-Wide Companies |
Modelling Perspectives: Industry vs. the Firm
Our aggregate industry model is composed of 4 main sectors and 5 sub-sectors. The main sectors represent the supply side, the demand side, the financial institutions that provide financing and the market where supply and demand match. Within the supply side we have modelled 4 sub-sectors that represent industry physical capacity, capacity ageing, investment, pricing and financial policies respectively. Within the demand side we represent demand growth and price elasticity. Within financing we represent the availability of capital, and finally within the market we represent the industry aggregate supply curve and the process by which supply and demand clear through price.
Although our main focus here is the industry model, it is worth mentioning that our planned business level model is based on several classes of players. Players adopt alternative dominant logic emphasising investment criteria such as NPV maximisation, or market share, or option purchasing for the future, etc. This multi-logic view is helpful in explaining complex industry behaviour whose causes stem from different strategies of firms in the industry that cannot be fully explained at the aggregate industry level (see Bunn & Larsen 1992 and Morecroft & van der Heijden 1992 for multi-player/multi-logic models of the UK electricity and global crude-oil markets respectively) . The full implementation of such firm level explanations are beyond the scope of this paper.
Pricing and Investment Policies
Industry pricing and investment policies embody two main objectives (a) to maintain an industry capacity margin (so that no supply shortages occur) and (b) to achieve long term return on invested capital (ROIC) equal to weighted average cost of capital (WACC).
Pricing builds on cash and reinvestment costs that all companies strive to recover, and is augmented by expected utilisation: low utilisation drives price down to rock-bottom cash cost, while high utilisation allows price to rise sharply above cash cost. This adjustment to price from utilisation takes into account not only the current supply-demand balance but also the expected supply-demand balance for all capacity that is mothballed, under expansion and ramping up. So the pricing formulation reflects an assumption that policy makers take a broad and well informed view of supply and demand in setting their prices.
Similarly, supply and demand expectations are used for investment decisions. Investment depends on the expected gap between supply and demand viewed across a time horizon representing the interval between financial approval and completion of capital projects.
Finally, and most significantly for the model's theory of industry cyclicality, the availability of financial capital influences the size and speed of new capacity orders. The more financial capital available the higher the rate of investment, and vice-versa.
In this behavioural theory, cyclicality arises from the unintended interaction of industry investment policy and the financial institutions that fund investment projects, rather than imperfect knowledge of capacity in development as assumed in many classic dynamic models of investment cycles (see for example Mass 1975 for a description of policy structures underlying macro-economic investment cycles).
Model Communication and Confidence Building
The model's dynamic behaviour has been examined and validated by a chemical industry expert. To aid validation a special model user interface was built using VenApp, the application builder of Vensim. This visual interface provides the industry expert with slide bars to adjust a wide range of industry structure parameters. The result is a valuable communication tool. The interface has allowed our industry expert (who was not himself an experienced modeller) to explore model structure and dynamics, and to test his hypotheses on the drivers of cyclicality. Our future intention is to adapt the model's interface to a variety of different chemical products. Users would then be able to test cyclicality scenarios for particular chemical products of their own choice.
In addition, a gaming interface has been developed for players competing against a multiple player industry.
Emerging Insights
The model replicates quite well observed industry behaviour when it is parameterised for a product whose behaviour is known and documented. Figures 3 to 6 depict model behaviour for our base case.
Overall, the model has verified our hypothesis that while industry "physics" may trigger cyclicality, it is the industry's investment, funding and pricing policies that sustain the cycle and damage industry profitability. These seemingly reasonable policies lead to feast-and-famine in financing that inadvertently exaggerates cyclicality. Further simulations reveal that individual players can achieve superior and above average returns by securing constant financing and by employing anti-cyclical investment policies. Such investment and funding policies continuously reinforce the industry's cost position and help them sustain returns above WACC.
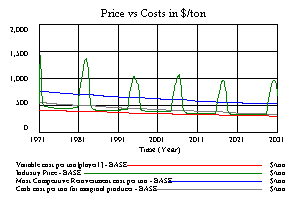
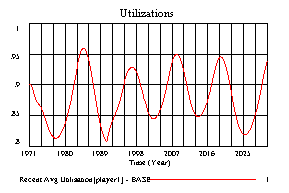
| Figure 3: Price Evolution | Figure 4: Industry Capacity Utilisation |
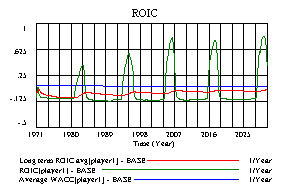
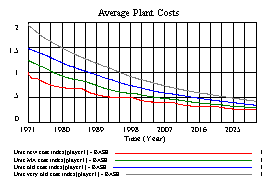
| Figure 5: ROIC vs. WACC | Figure 6: Industry Cost Curve Over Time |
However if we assume that counter-cyclical financing is not an available option the question is what other levers can be used to improve industry performance. Some of the high leverage points seem to be the plant size for new investments (smaller plants create more value) as well as the plant design and construction times (faster construction creates more industry value).
The model is currently helping us understand how cyclicality and value are influenced by a number of other industry parameters like rates of demand growth, investment costs, rates of fixed and variable cost cutting, etc.
Future Work
We believe that deeper understanding of chronic cyclicality lies in modelling different classes of players.
Our current research plan includes better understanding of the incentives and dominant policy logic (i.e. the objective functions) of different players. It will be interesting to see how changes in the balance of dominant logic (resulting say from changes in market share of major players) can alter the course of industry evolution and how existing players should encourage or discourage certain evolutionary paths.
An additional objective is to understand the leverage available to firms to mitigate industry cyclicality, by adjusting managerial incentives that shape investment. To explore this issue of leverage we are currently developing a "gaming" microworld that presents players with alternative incentive schemes. Such a microworld should allow us to discover experimentally how different incentive schemes can lead players to adopt local investment rules that improve long-run industry profitability.
References