Due to the globalization of industrial firms the structure of supply chains is getting more and more complex. Production plants spread all over the world, long distances between supplier and plant as well as Just-in-Time-Production for the customer mean complexity, dynamics and high risks. Modeling these structures with a System-Dynamics-Tool like Vensim can help in identifying and eventually solving most of the problems.
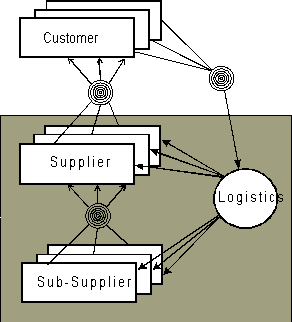
The basic structure of this model is a three step production and logistics system (Figure 1). The gray box symbolizes the boundary of the system. The customer's data, like orders are all exogenous.

Each supplier is modeled with the same structure. An inventory for the incoming goods, an inventory for the outgoing goods and a production delay. Furthermore, capacity (machines) and personnel is also included.
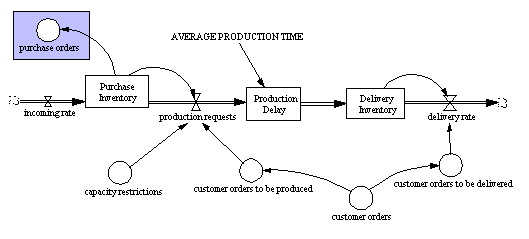
All the plants of the suppliers are located directly at the customer plants. The sub-suppliers are spread all over the world (in the actual model they are located in Europe). There is no transportation needed between customer and supplier, the transportation between sub-supplier and supplier is modeled with a simple third order delay. The goods, flowing through the system, are indexed with type-of-product, supplier-location and sub-supplier-location (three-dimensional-array). Each sub-supplier is able to produce each type of product for each supplier. Figure 3 shows the two implemented logistic systems.
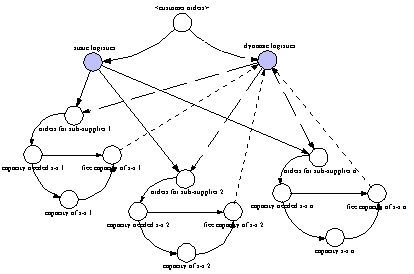
Orders received by the sub-suppliers have an average lead time of four weeks (Time step of the model is one day, the DT used for integration is ¼ Time step), therefore the probability of the job order setup is not 100%. The nearly exact orders are placed by the customer at the supplier one day before the parts are needed and exactly placed the next day, the relationship between customer and supplier is a JIT-system. So there is the risk that the sub-supplier manufactures and delivers the wrong products or the wrong number of products needed. If the supplier detects a lag of a special product, he is able to place an immediate order at a sub-supplier. These orders are then taken out of the inventory of the sub-supplier or immediately produced and shipped via express services.
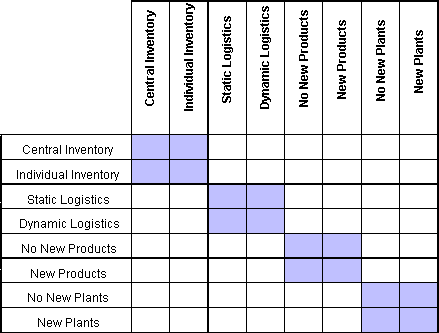
Due to several switches, parts of the model can be activated or deactivated. For example the ability to hire personnel, buy new machines as well as extra production plants or new products can be simulated. To measure the performance of these various structures total costs as well as the average cycle time of a product and supply capability are used. Table 1 shows several structural alternatives.
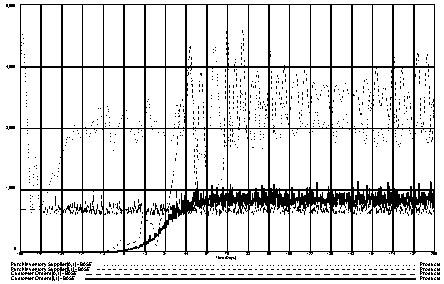
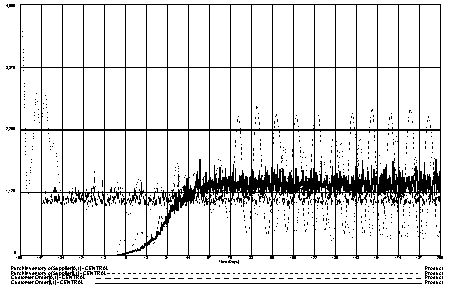
The following figures show simulation runs with and without a central inventory. Figure 4 is a run with individual (purchase) inventory, the figure shows the purchase inventory and the customer orders, a new product (I) is introduced at day 0 (Simulation starts at day -60). Activated structures: Hiring of personnel, buying new machines, static logistics, no new plants. Figure 5 is the run of the model with central inventory.
References:
Bhote, Kheki R.1989. Strategic Supply Management. New York: AMACOM.
Dobler, Donald W./David N. Burt. 1996. Purchasing and Supply Management - Text and Cases. New York et al: McGraw-Hill.
Forrester, Jay W. 1968. Principles of Systems. Cambridge/MA: Productivity Press.
Forrester, Jay W. 1961. Industrial Dynamics, Cambridge/MA: Productivity Press.
Milling, Peter. 1981. Systemtheoretische Grundlagen zur Planung der Unternehmenspolitik. Berlin: Duncker & Humblot.
Ventana Systems: Vensim User's Guide & Reference Manual, Ver. 1.62.