 Fig. 1: The push
model
ABSTRACT
A few years ago a European telecommunication firm started a deep reorganization project aimed at improving production process performance in order to quickly respond to big market changes.
Such a project, which is still in progress, concerns both technical (i.e. machinery) and organizational (i.e. pull production control system, total quality, etc.) points of view.
A system dynamics model has been sketched in order to estimate potential benefits coming from a shift from the actual production system (mainly based on a push approach) to a pull system, based on kanban methodology.
Even though the model is focused on a bounded management area,
the goal of this paper is to stir up a growing managerial concern
in the System Dynamics methodology within the firm.
1. COMPANY'S AND MANAGEMENT PROBLEMS' OUTLINE
Teltronic Co. produces and sells electronic devices. Due to the globalization process in the telecommunication market, the company is now investing growing resources in order to improve its market share in foreign countries. For this reason, it has started a deep reorganization project aimed at improving production performance.
Overstocking is a main problem which production management is facing now, due to the need to overcome competitors' growing efforts to improve sales orders lead times. Major drawbacks of overstocking are not only related to higher financial costs on inventories, but particularly on potential obsolescence costs, which are a big deal in such a highly dynamic industry. In order to better manage such organization problems, System Dynamics has been used to model production dynamics to support decision makers to evaluate main strengths and drawbacks related the push and pull approaches.
A simplified model and related results will be discussed.
2. THE PUSH MODEL
Teltronic production system is now based on a push approach. Production process consists of three main stages: (1) automated assembly, (2) manual assembly and soldering, (3) testing.
Figure 1 shows a stock and flow model concerning a push production process.
 Fig. 1: The push
model
Fig. 1: The push
modelThe main model's structure describes production "pipeline". It starts from raw materials orders rate, which feeds the production line and closes with a shipping rate. A chain of three "cascaded" stages connects raw materials with shipping rates.
Production and raw materials orders are calculated on the base of a past sales orders smoothing and a finished products desired coverage. Weekly sales orders have been modelled as a step function, whose value randomly changes.
Both in the push and in the pull models, each production
stage has been represented as a second order negative feedback
loop. In fact, production rate starts the process and accumulates
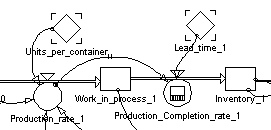
into a work-in-process (WIP) stock; production completion rate
depletes WIP and accumulates into Inventory stock. In order to
calculate production completion rate, a "delay pipeline material"
(delaypplmtr) function has been used, rather than a WIP/lead
time ratio, to better represent system's behaviour (i.e. production
capacity constraints, inventories availability according to different
production batches, etc.) (fig. 2). Both push and pull
models are based on a simplified hypothesis that only a product-code
is manufactured.
3. THE PULL MODEL
Fig. 3 shows the pull model, which is based on the same production structure (i.e. the same stocks and flows, delays) of fig. 1.
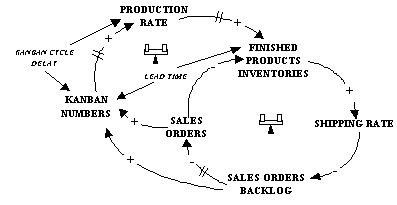
The main difference between the two models is related to the "kanban sub-system". Such a sub-system allows one to calculate minimum inventories (number of kanbans) at the end of each production stage as a function of weekly sales orders. In order to achieve desired inventories, the same sub-system authomatically calculates production orders at each stage (fig. 4).
In other words, while in the first production system expected orders are pushed from the beginning of the line, in the second system actual sales orders pull inventories from the end of the line and, consequently, give rise to production orders in the previous stages.
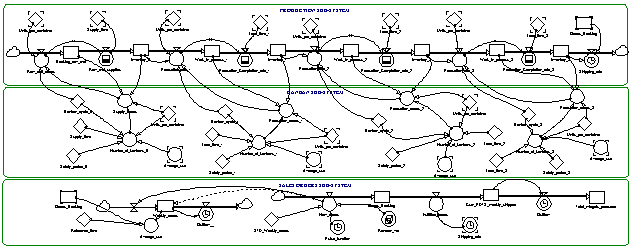 Fig. 3: The pull
model
Fig. 3: The pull
model4. COMPARATIVE RESULTS
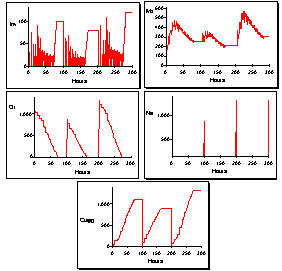
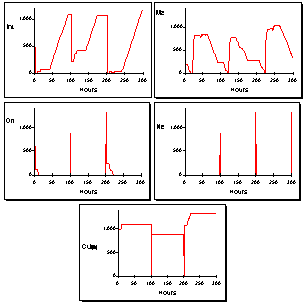
Fig. 5 shows main results from a simulation run of the two models, based on a same sales orders pattern (see "new_orders" graphs). As it is possible to notice from the graphs on the top, both finished ("Inventory_3") and in-process inventories are by far lower in the pull than in the push system. This is a significant advantage of the pull system, as it may allow to reduce financial and obsolescence costs on inventories.
On the other hand, although both systems are able to meet sales orders weekly schedules, in the push one end products availability is higher than in the pull system (see orders backlog dynamics). Obviously, higher end product inventories (Inventory_3) may allow a quicker customer orders' satisfaction.
It is worthwhile to observe, however, that - particularly with regard to the push system - the model's performance may be over-estimated. In fact, if we should remove the hypothesis that only a product-code is manufactured, we would have not only to consider the absolute quantity of inventories (i.e. "Inventory_3" value), but also whether such quantity is balanced on different kinds of product-codes in stock.
5. CONCLUSIONS
A next development of this research will be oriented to include in the system's boundaries also multiple product-codes and bottlenecks.
System Dynamics will be also used to support managerial learning
about the system's behaviour in reacting to external "shocks"
(i.e. sudden demand changes, bottlenecks, etc.) and how delays,
non-linearities and feedbacks may affect master variables performance
over time.
6. REFERENCES
- Monden Y. , "Toyota production System : Practical Approach to management". Industrial Engineering and Management Press. Norcross. 1983.
- Hall R.W., "Syncro MRP : Combining Kanban and MRP - The Yamaha PYMAC System". I.E.M.P. 1986.