INTRODUCTION
The world production of barley is ranked in fourth place in agricultural productions, after wheat, corn and rice. It is primarily used for feeding animals and for the production of beer. Europe and North America are the biggest producers in the world, while Spain is the EU country with the largest surface devoted to this cultivation. The Spanish region of Castilla-León is the one that obtains the highest production. The agricultural sector in this region employs 16% of the active population and contributes with 12% to its GNP (gross national product)and thus to the importance of an analysis on the viability of its exploitation.
The objective of this work is to build up a dynamic system model of a representative exploitation in the agricultural sector from a specific area in the autonomic community of Castilla-León, in order to be able to evaluate whether C.A.P. (common agricultural policy) rent perception objectives are being fulfilled. Initially we suppose that the owner of the exploitation has a quantity of land of a certain quality, fully devoted to barley cultivation in dry land, machinery differentiated by time of usage and purpose, a certain liquidity to meet the expected costs during a period of time that concludes with new income contributions and lacks financial costs. Further, we consider that the exploitation policy is to buy seed for the sowing and sell to the product to market price after the harvest and insure its expected harvest yield. The sowing is planned to be carried out at two different moments; thus, if the weather conditions are good, half of the land is sowed in the autumn and the rest always in winter. The work factor is contributed by a single qualified person, except the harvest of the grain which is performed by three persons.
In the causal diagram we distinguish between four subdiagrams that correspond to differentiated processes for the farmer's rent attainment: production attainment, cost formation, income formation and decision evaluation subsystem as a function of results.
PRODUCTION
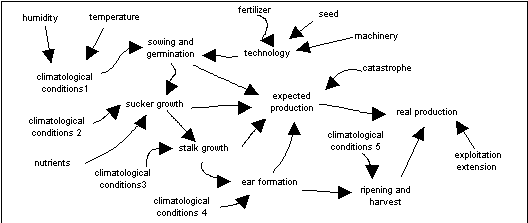
The development of the barley plant is the result of sequential and dependent biological processes that take place during a period of time between October and July the following year. They start with the sowing and end with the harvest. Though it is possible to consider different stages (Molina Cano, J.L. 1989), we group them into five: seed sowing, stalk formation, stalk growth, ear formation and finally ripening and harvest. The result of each one of these sequential processes may be altered by the behaviour of two external random variables: rain and temperature, which we group in the causal diagram under "climatological conditions". In statistical terms, it may rain between 200 l/m² in dry years and 450 l/m² in wet years in the selected area. The temperatures vary according to the month of the year, but the association of water-temperature turns out to be essential to the success of the cultivation. Under the denomination "catastrophe" we also include the possibility of meteorological situations, not frequent but possible, that may hinder one of the processes, and thus the subsequent ones, from finishing. These events of almost entire harvest loss occur on some occasions, latest in 1995. Figure 1 contains the causal diagram of the expected autumn sowing production. Winter sowing can be considered analogous.
Figure 1

In the causal diagram a variable is associated with each result of the biological process that gathers production expectations as a function of the biological result. These expectations may be modified as a function of the results of the subsequent processes, which is a common characteristic in cereal development. In the variable technology we include other elements like machinery used, seed quality and nutrients added to the soil before and after the sowing, which also affects the result of the production. The contribution of these factors to the result is not statistically proved, thus we will base our modelisation of the system on expert opinions.
COST FORMATION
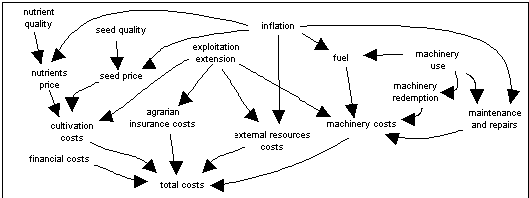
All inputs necessary to obtain the production have an associated cost. Discarding the land redemption cost, we have machinery redemption costs, maintenance, repairs and energy costs and costs of seeds and nutrients used during the growth and maturing process of the plant. When the grain is harvested we also have a cost associated with the harvest and finally we have the cost of the agrarian insurance. Furthermore, we will have to consider financial costs when the farmer decides to turn to the financial market in search of capital. It can be observed that all costs, except financial ones, are a function of the extension of the cultivated exploitation. Figure 2 contains the causal diagram of the annual costs associated to the exploitation.
Figure 2

INCOME FORMATION
Income is obtained by the farmer of the exploitation by means of the subsidies from the C.A.P. and sales of the production obtained. The subsidies from the EU are determined according to the quantity of exploited land and the area where the cultivation is carried out. If we suppose that the farmer has 40 hectares (Ha.) in the area of study, and therefore, is not obliged to withdraw 15% of the surface from cultivation, the EU assigns him an average production of 2,2 Tm/Ha. and a subsidy of 15.294 ptas. per Ha. during the period of 1995-96. Although the future evolution of these aids is still to be determined, it seems evident that they represent an important percentage of the farmer's rent. In order to be able to know the income per production it is necessary to determine the price of barley. This price can change from day to day but the variations experienced in one year are within limits that do not noticeably affect the rent of the farmer under study (variations have reached 0,5 ptas. in the current year). However, world, communitarian and, especially, national production do influence the so-called seasonal price. Figure 3 represents the relationship between the variables that determine the income. The possibility of a catastrophe is included in the diagram. In such a case, there would not be any production and consequently, no sale, so the income would be obtained from agrarian insurance and communitarian aids.
Figure 3

FORMATION OF DECISIONS
Profits are determined by income minus costs, ie if we deduct taxes we get the farmer's rent. Now it is possible to compare the result with the average rent obtained by other sectors located in the same area and obtain conclusions about the objectives pursued by communitarian aids. If the comparison between rents is acceptable, the farmer may decide to stay in the sector. Age plays an important role in this decision. If the farmer has a rent surplus and expectations of future rent, he may opt for either improving the technology used in the productive process or increasing the quantity of land. Note that the value of land has increased because C.A.P. subsidies are guarantied. In any case, the possibility of the farmer turning to the financial market, in order to obtain capital for investments,has also to be considered.
Figure 4

Figure 4 contains the possible decisions that the farmer may make after a productive period and it closes the feedback loop of the dynamic system.
REFERENCES
Melero, R., Machuca, A.D. 1995. A model for learning about the agricultural business system. Proceedings of the 1995 International System Dynamics Conference. Tokyo: T. Shimada and K. Saeed.
Molina Cano, J.L. 1989. La cebada. Morfología, fisiología, genética, agronomía y usos industriales. Madrid: Mundi-Prensa.
Tiffin, R., Renwick, A. 1996. Estimates of Production Response
in the UK Cereal Sector Using Nonparametric Methods. European
Review of Agricultural Economics 23 (2): 179-94